
This article is the English translation of the original in Danish that was published in December 2020 in Finans/Invest. You can download the original here.
It was written in collaboration with Frank Hvid Petersen.
Introduction
We know pretty well how liquid assets like equities, bonds and credit perform in an economic downturn or during market turmoil. But how about alternatives, an asset class that investors have poured trillions of dollars into in the past 10 years? How will they fare during a downturn? How recession-proof are they and how much downside return protection are they able to provide?
These questions are very important to try to answer. Not only because of the growing importance of alternative investments in portfolios over the past decade. But also because of the record low bond yields. Many bonds, including government bonds, mortgage and municipality bonds, and A-rated corporate bonds, have historically provided investors with a significant downside return protection. Today, these bonds are unable to deliver their usual return protection in the next downturn and they also have a reduced weight in most portfolios.
Thus, alternative investments will play an increasingly important role in most portfolios during the next downturn. Will they pass the test?
Some of our findings are:
- Commodity Trading Advisers (CTA’s) are the only asset class that has delivered consistently positive performance through all major crises during the last 40 years and the COVID-19 crisis has so far been no exception, but with huge dispersion on the underlying managers.
- Real estate is generally a good diversifier during economic downturns except when valuation is very high like in the early 1990’s recession or the GFC. In sum, real estate has had a very mixed performance across historical crises and sub-asset classes like Retail, Office, Industrial etc.
- Infrastructure delivered positive returns during the tech-bubble and incurred only limited losses during the GFC. The performance is depending on sector & business model, with very different cyclicality and interest rate sensitivity across regulated, contracted and merchant infrastructure;
- Private Equity is not a good diversifier as it posts some heavy losses like equities in an economic downturn as they are influenced by the same economic factors. There has, though, been large differences in the performance of sub-asset classes like Venture Capital and Buyout and among the underlying managers;
- Insurance-Linked Securities (ILS) is a young asset class that is expected to deliver very uncorrelated returns and the experience during GFC and the current downturn has so far confirmed that trait;
- Rules of thumb do not always hold water on closer inspection, e.g. that real estate investments are always negatively affected in the event of rising interest rates and, conversely, benefit from more lenient monetary policy and lower interest rates;
- Country risk, especially within the Eurozone, should be given special attention at the current high levels of government debt, as future recessions could trigger significant tensions and reactions of great importance to the return on alternatives;
Overall, it must be concluded that based on historical experience, investors with significant shares of their portfolio invested in alternative investments, i.e. most institutional investors in Denmark and the Nordic countries, should analyze how their alternative investments may perform in a future economic downturn;
Methodologies, data issues etc.
To gauge how recession-proof the different alternative asset classes are, we look at their performance during historical periods of recessions or market turmoils.
Before we present the analysis, a couple of points to make. Firstly, alternative investments cover a very heterogenous group of different asset classes with highly different characteristics, such as commodities, real estate, infrastructure, hedge funds, private equity, direct lending, CLO’s, etc. And often, each asset class comprises several sub-asset classes that in turn possess very different characteristics, also in terms of behavior during an economic downturn.
Secondly, data is a problem. Several of the assets in question are illiquid and price data are infrequent (typically quarterly) or based on appraisals with a time lag. Another problem is lack of available data as many indices – or even asset classes indeed – simply did not exist just a few decades ago. This is illustrated quite well by the fact that for only 2 out of 6 analyzed alternative asset classes data was available for the period of the Volcker recession in the early 1980’s. Short time series and lack of recessions/crisis to analyze makes our results less robust.
Thirdly, several of the return indices analyzed are appraisal-based and not market based, e.g. based on transactions. To overcome the issue of smoothed time series due to appraisal-based indices, we use a “first order autoregressive reverse filter”, cf. Anson (2012).
True Return_T = (Return_T – a * Return_T-1 – b * Return_T-2) / (1 – a – b)
We settled for the proposed values for a = 0,3 and b = 0,2.
The intuition behind this model is, that appraisers tend to not react quickly enough to changes and put too much weight on past returns. By removing some of the influence of past returns, the time series reacts both faster and more strongly, resulting in less autocorrelation and higher standard deviation and – most often – higher correlation to listed markets.
Finally, several asset classes, including private equity, venture capital and hedge funds, are characterized by a huge alpha element and big manager dispersion in performance. Annual return differences of 5-8 percent or higher are not uncommon between top and bottom deciles of managers. Thus, a lot of investors will find that the available data on the asset’s average performance is not representative. Historical performance is absolutely not a guarantee of future performance.
The performance of Alternative investments during historical crises
We have deliberately chosen the following asset classes in our analysis:
- Commodity Trading Advisers, also known as Managed Futures, from the Hedge Fund universe as they are expected to deliver “crisis alpha”;
- Real Estate, as this is one of the largest alternative building blocks in a typical institutional asset allocation;
- Infrastructure, as this asset class has caught the attention of investors recently with massive inflows as a result;
- Private Equity, divided into Buyout and Venture Capital, as this asset class is widespread in institutional portfolios and has been debated a lot whether it truly offers diversification or not;
- Insurance-Linked Securities, as this is the most alternative within the alternative investment space and it by design should be uncorrelated to the rest of the portfolio;
We start our analysis by looking at the performance of these selected alternative investments during historical crises that we define as negative equity markets and/or noteworthy macroeconomic events.
It is worth pointing out that no two crises are identical, which is helpful to our analysis as we want to identify different drivers of performance and to see, whether some alternative investments have a general robustness or not.
The Volcker recession in 1980 to 1982 (it was a double-dip recession but we have merged them into one) was characterized by high but falling inflation (12,5% to 7,1%), rising interest rates (10Y US Treasury yield from 12,42% to 14,44%) and only moderately negative equity returns (-12,4% nominal which translates into -22,0% real returns).
Black Monday, the large stock market crash of October 19th, 1987, was the first version of a financial crisis triggered by computerized trading. It was characterized by steep losses in equity markets and moderately falling interest rates and easing inflation.
The early 1990s recession was the result of several negative factors coming all together: restrictive monetary policy to fight inflation, the deflating of a real estate boom and finally an oil price shock in 1990 where prices tripled over a period of just four months.
The dot-com crash starting in the summer of 2000, on the other hand, followed a period of “irrational exuberance” (former Fed chairman Alan Greenspan) that manifested itself in elevated valuations in different parts of the stock markets, especially technology, media and telecom.
The Great Financial Crisis of 2008 (herein after referred to as ‘GFC’), triggered by a real estate bubble in the United States that – while deflating – led to the failure of hundreds of banks around the globe and brought the whole financial system to the brink of a meltdown and triggered a severe economic downturn.
Finally, while this article has been under way, we have been hit by a Covid-19 recession and we do not yet know if it is completely over yet, and we present the first data on how the alternative asset classes have fared in the first half of 2020.
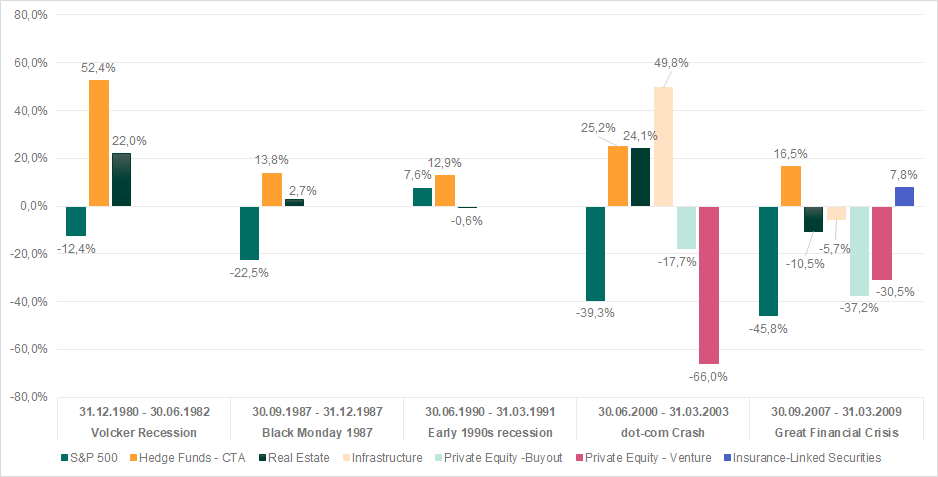
The table and chart below show the performance of the various asset classes during these crises.
| Volcker Recession | Black Monday 1987 | Early 1990s recession | dot-com Crash | Great Financial Crisis | |
| Nominal returns | 31.12.1980 – 30.06.1982 | 30.09.1987 – 31.12.1987 | 30.06.1990 – 31.03.1991 | 30.06.2000 – 31.03.2003 | 30.09.2007 – 31.03.2009 |
| S&P 500 | -12,4% | -22,5% | 7,6% | -39,3% | -45,8% |
| Hedge Funds – CTA | 52,4% | 13,8% | 12,9% | 25,2% | 16,5% |
| Real Estate | 22,0% | 2,7% | -0,6% | 24,1% | -10,5% |
| Real Estate – unsmoothed | 17,5% | 3,6% | -3,2% | 22,3% | -24,9% |
| Infrastructure | N/A | N/A | N/A | 49,8% | -5,7% |
| Private Equity -Buyout | N/A | N/A | N/A | -17,7% | -37,2% |
| Private Equity – Venture | N/A | N/A | N/A | -66,0% | -30,5% |
| Insurance-Linked Securities | N/A | N/A | N/A | N/A | 7,8% |
Source: Bloomberg
BarclayHedge CTA Index, NCREIF Property Index, EDHECInfra Global Private Infrastructure Equity Index, Thomsen Reuters Private Equity Buyout Index, Thomsen Reuters Venture Capital Index, Eurekahedge ILS Advisers Index USD hedged
BarclayHedge CTA Index, NCREIF Property Index, EDHECInfra Global Private Infrastructure Equity Index, Thomsen Reuters Private Equity Buyout Index, Thomsen Reuters Venture Capital Index, Eurekahedge ILS Advisers Index USD hedged
Commodity Trading Advisers (CTA)
Commodity Trading Advisers, (herein after referred to as ‘CTA’), are a sub asset class within the Hedge Fund space. Even though the name could indicate that they only trade commodities, this is far from being true. Even though the beginning of this asset class indeed was in commodities trading, these funds also trade equities, rates, currencies and credits – mostly in the very liquid futures space. Hence, also the alternative name ‘Managed Futures’.
CTA are notoriously known for employing trend following models, even though not all CTA are trend followers. Given the very high correlation (0,97) between a broad CTA index and the Trend sub-index, it is reasonable to assume that trend following makes a large part of the universe.
CTA trade, as mentioned, futures on various asset classes – both long and short. As they are able to trade both long & short, CTA are supposed to give a positive total return irrespective of the developments on the markets. Contrary to pure downside protection strategies like buying put options or long volatility futures, CTA should ideally give downside protection in prolonged bear markets while not being a performance drag during bull markets. The worst environment for CTA strategies is thus a “whip-sawing” market, i.e. rapid trend reversals without clear trends in either direction.
Recent research, like that from PivotalPath, a hedge fund data firm, claims that CTA performance can be explained mostly by being long rates instead of being short equities during the last equity bear markets.
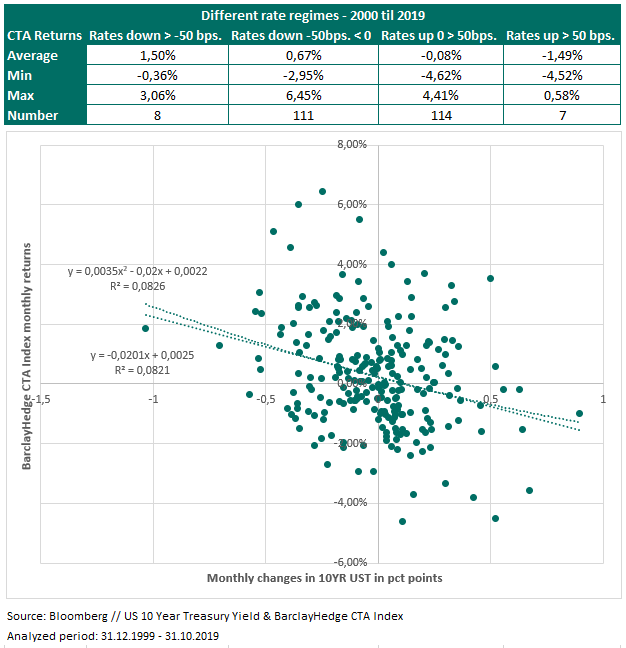
Our own research confirms that CTA performed much better during falling rate regimes, at least during the last 19 years. When using the full sample of the BarclayHedge CTA index since 1980, it indicates that CTA post the biggest gains during times of large movements in rates – irrespective of the direction, which is also what normally should be expected. On the other hand, given the very long trend with falling rates, it can be expected behavior of trend following investors to be positioned for lower rates, being long rates.
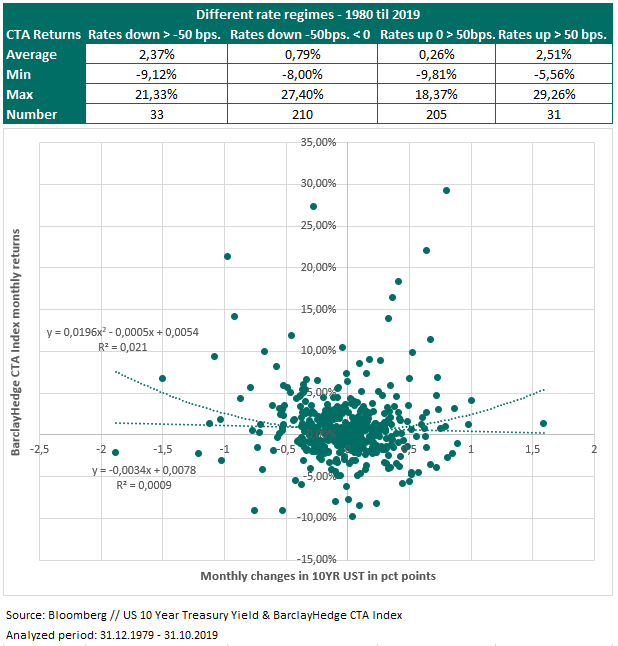
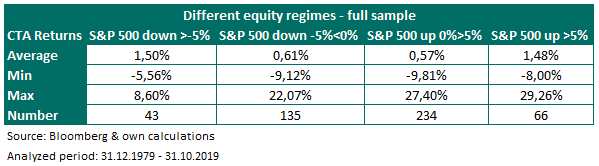
The same pattern emerges for equity market performance. For the whole sample, CTA had the highest average returns in the tails of the distribution. This supports our thesis that – while the overall beta is close to zero – CTA have conditional betas that are more negative / positive during bear and bull markets. However, the low R-squared’s dampens our excitement a bit.
During the last 19 years, CTA posted the biggest average gains during the negative months while there is no difference between moderately and strongly rising equity markets.
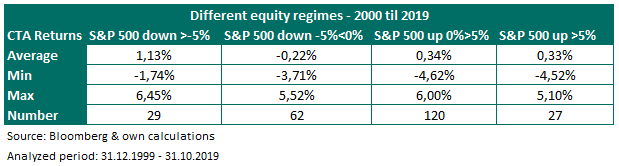
While CTA indeed profited from being long rates during the past many years, there is no reason to doubt that they can profit from a prolonged trend of rising rates if or when this might happen. Historical data shows that CTA also thrive in rising rate environments – given that the moves are large enough and occur over long enough time periods for the models to board the leaving train.
Commercial Real Estate (CRE)
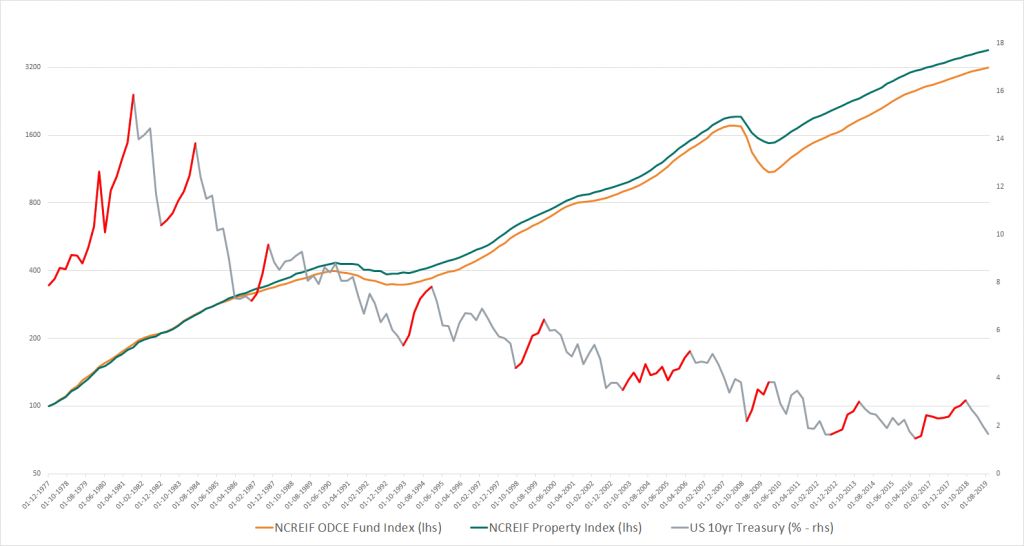
Commercial Real Estate (herein after referred to as ‘CRE’), as represented by the NCREIF Property Index (NPI), consists of five sub assets classes: office, retail, industrial, hotel and apartment. The NPI is an unlevered index. The NPI is an appraisal-based index and hence suffers, like all appraisal-based indices, from substantial return smoothing. According to NCREIF these issues was largest during the early days of the index and during the Early 1990’s recession while the data quality was already better during the GFC. Nevertheless, we therefore have unsmoothed the NPI, as described under methodologies, and based our analysis on both smoothed and unsmoothed returns.
The total return of CRE is the sum of capital gains and rental income. As shown in the first table above, CRE produced positive total returns in 3 out of the last 5 crises and was only slightly down during the early 1990s recession but it is worth noting that, even after unsmoothing the time series, the bottom was first reached nine months after the official end of the recession.
The max drawdown chart below for respectively NCREIF Property Index (both raw & unsmoothed) and the S&P 500 shows that drawdowns in real estate markets – at least in the US – not necessarily are correlated with equity market drawdowns. In addition, the chart also shows that the max drawdown of the unsmoothed series was close to 30% during the GFC, albeit the drawdown during the “official” GFC period was smaller.
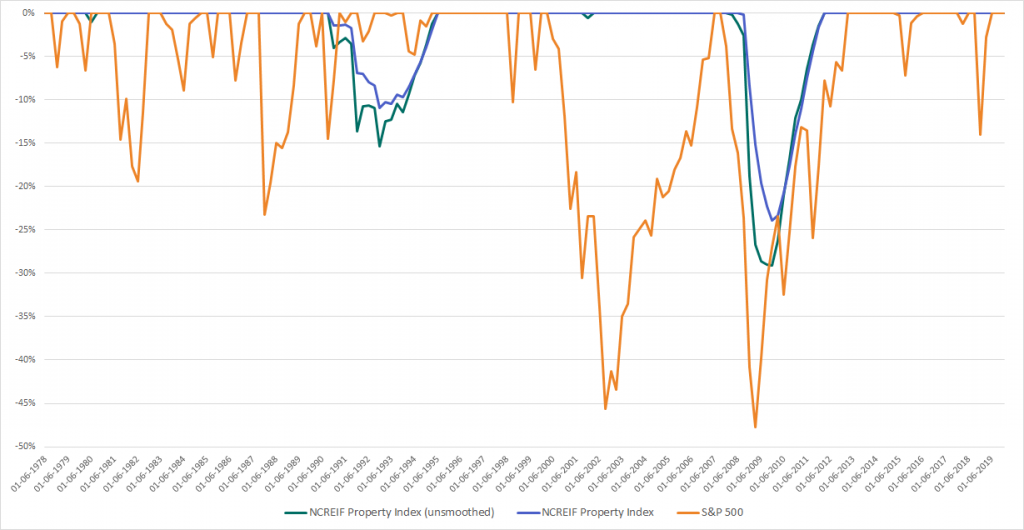
Source: Bloomberg, NCREIF & own calculations
Returns in real terms could keep up with inflation throughout 3 of the 5 crises, even during the high inflation period in the early 1980’s, which makes intuitively sense as real estate should be a good – albeit not a perfect – inflation hedge due to several reasons:
- Many rental contracts are inflation-linked, though typically with a lag of between 6-12 months
- Replacement costs rise as well, which should support the valuation of existing properties
- If wages increase less than prices, it will be hard to put through rent increases on apartments which could leave apartment as non-perfect hedge but still better than nominal cash flows
A recent study from CBRE for example shows that property values keep quite good up with inflation with retail and apartment being close to a perfect hedge and industrial and office a partial hedge having an elasticity of 0,91 and 0,74. Rental income, on the other hand, has an even bigger dispersion with retail still being a perfect hedge, industrial and apartment a partial hedge and office being not an inflation hedge with an elasticity of 0,18, cf. Wheaton (2017).
The NCREIF Property Index had since inception in 1978 only two periods of negative nominal and real returns:
- After the building boom of the late 1980’s and the Savings & Loans crisis in the early 1990’s
- During the Great Financial Crisis
The latter of those two was much more severe and hit all the sectors while the Savings & Loans crisis hit Office the hardest with losses of -22,4% while Apartment in fact gained 3,3% during that period. Both periods were preceded by a period of high supply and speculation.
A common fear is that CRE will post negative returns when / if interest rates will rise. We could not find evidence for this in the historical data. We have analyzed those periods where the US 10Y Treasury rate increased by at least 100 bps. Only in one out of these nine periods, CRE had negative total returns. This was in fact during the GFC where we with certainty can conclude that this was not driven by an increase in interest rates but by several other factors like falling demand, less available financing and general risk aversion.
Source: Clarion Partners, Bloomberg, NCREIF & own calculations
A potential explanation why CRE not necessarily needs to post negative returns because of an increase in rates is, that rates very often tend to rise in periods of high economic activity. This can best be explained by a simple example that shows how the value of a property is derived as a function of the rental income and the yield. Yield (also known as cap rate) is the earnings yield of that property, not the treasury rate.
The value of a property can be expressed by the equation:
Value = Net Operating Income / Yield
If, for example, the net operating income (NOI) is $100.000 p.a. and the property has a value of $2.000.000, the yield is 5% p.a.
If rates in general rise and the cap rate in that connection rises to 7% would this, all else equal, lead to a decrease in value to $1.428.571, a loss of $571.429. However, due to higher economic activity, the owner might be able to negotiate higher rents or reduce vacancy and thereby increase NOI. An NOI of $140.000 would be enough to offset the cap rate increase from 5% to 7%. But even a small decrease in value might easily be offset by the rental income and thus still lead to a positive total return despite a falling property value.
In addition, it is not certain that rising rates will lead to rising cap rates. Historical analysis shows, that cap rates were either falling or flat during 3 out of 4 periods with rising rates. The one situation where both cap rates and interest rates were rising simultaneously was during the GFC. Cap rates were starting their rise already earlier, following an all-time low, while rates were falling. As already mentioned, we are quite certain that this was in fact driven by other factors than just movements in rates. Rising rates could after all make new developments less attractive and thereby keep new supply down which, all else equal, should be supportive for the valuation of existing properties.
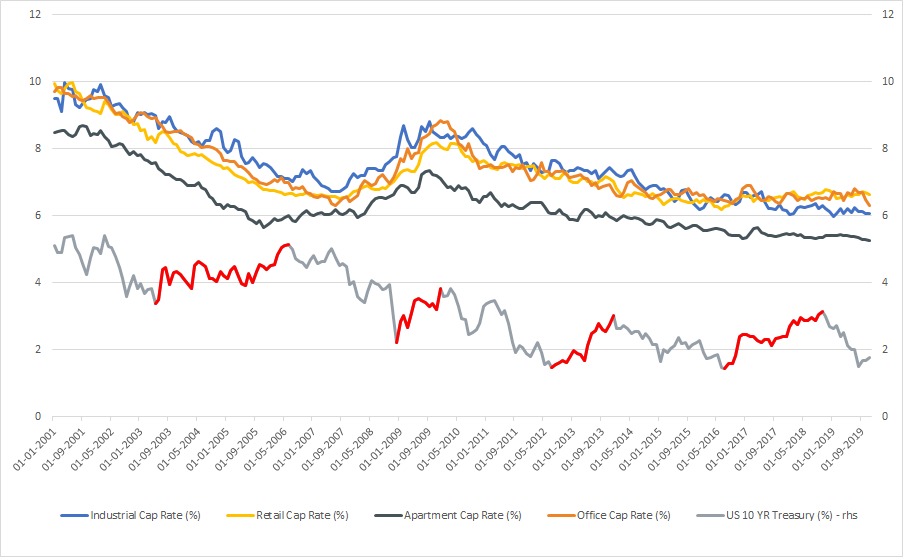
Source: Bloomberg, Real Capital Analytics & own calculations
While cap rate is an absolute level, the cap rate spread measures the excess rate over government bonds, like a credit spread. Even though the cap rate has come down since the GFC and now trades at all-time lows in some sectors, the cap rate spread is still at or above long-term average as the interest rates have come down even more. This leaves room for normalization of interest rates without necessarily going to the detriment of property prices as the spread can shrink before cap rates eventually might rise.
Real Estate has historically – at least during the last period of high inflation – been a good inflation hedge and we could not find evidence for too big an impact from rising rates. A major increase in rates from current level (0-1%) to 3% or even 5% might, however, have an impact. It seems that idiosyncratic risks like oversupply or a full-blown financial crisis have the biggest impact on total returns. Even though the recession in the aftermath of the dot-com bubble was severe, real estate did not suffer from it. Our thesis is, that this was due to the fact that prices, as indicated by the cap rate spread, were not driven up like during the run-up to the GFC.
Infrastructure
Infrastructure is a very heterogenous asset class that is diversified as such. A merchant power plant has very little in common with a highway with an availability-based contract, a port, or a datacenter.
To correctly assess the risks connected to infrastructure investments, it is simply not good enough to treat all assets the same. Infrastructure can be divided into three main risk categories:
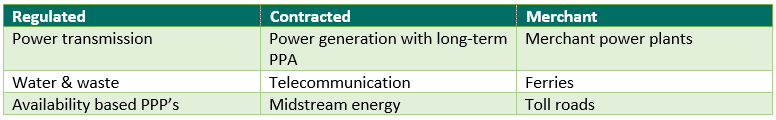
Contracted and regulated infrastructure assets are less exposed to the business cycle and macroeconomic shocks, with the caveat that macroeconomic shocks can change the regulatory environment, e.g. subsidies are cut back in consequence of deteriorated public finances. Otherwise the cash flows are relatively fixed and known for many years in advance. This should make these assets more vulnerable to interest rate shocks as the cash flow pattern comes close to a fixed-income instrument, likely an inflation-linked bond as the payments very often are linked to consumer prices.
Merchant assets, on the other hand, are depended on growth with volumes linked to the broad economy and population. These assets offer the highest potential for revenue growth, compared to contracted and regulated assets.
While it would be interesting to estimate the sensitivity to interest rates, GDP growth etc. of the different sub asset classes within infrastructure, we unfortunately only had access to the aggregate index across all sectors, the EDHECInfra infra300 index. This index measures the performance of 300 unlisted infrastructure investments in both corporates and project companies (SPV’s) and might be quite representative of an institutional infrastructure portfolio that spans across different sectors. EDHECInfra infra300 index is equally weighted and in local currency. It covers all investable sectors within infrastructure globally and all the different business models. The advantage of this index is that it is not appraisal-based, but based on a scientific process where asset prices are calculated quarterly using a discounted cash flow method and discount rates calibrated from secondary market transactions in the infrastructure market.
The scatterplot below, based on quarterly returns, indicates very low correlation between global infrastructure and S&P 500 returns over the last 82 quarters.
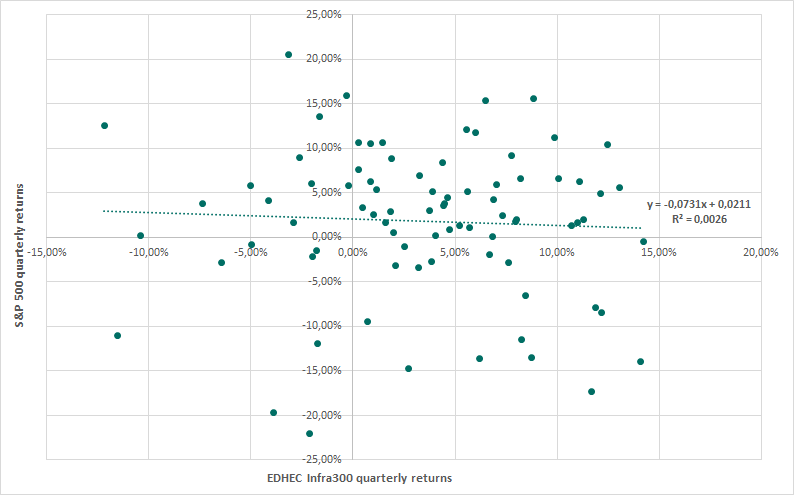
Analyzed period: 31.03.2000 – 30.09.2020
Even after unsmoothing the timeseries, as described under “Methodology”, the result does not change. A broadly diversified portfolio of unlisted infrastructure assets seems to be nearly uncorrelated to equity markets. To keep data consistent across all analysis in this article we used the S&P 500, even though the EDHEC infra300 Index is global and only has a minor allocation to the US. But we also ran the analysis against several local and global indices and the result – very low correlation – was still the same regardless of the chosen equity index.
Changes in 10Y US Treasury yields have a much higher influence on the quarterly returns than equity returns and the sign is – as expected negative – with a correlation of -0,43. According to EDHECInfra, the share of merchant assets in the index was during the last 10 years around 20% to 30%, while the share of contracted assets was between 45% and 50% with the remainder being regulated.
As already mentioned, regulated and contracted assets typically have cash flows that are less dependent on demand and more stable and thus closer to a fixed-income instrument, and hence, having higher sensitivity to interest rate movements. This view is supported by our analysis.
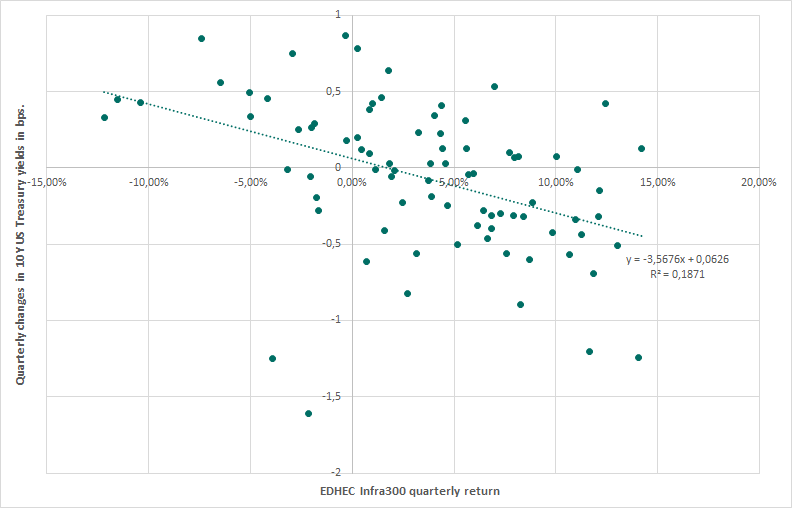
Analyzed period: 31.03.2000 – 30.09.2020
One of the most comprehensive research papers on factors influencing prices, and thereby also returns, on unlisted infrastructure we have seen so far is a publication of the EDHEC Infrastructure Institute, cf. Blanc-Brude and Tran (2019). Here, the authors find not only the already mentioned interest rate sensitivity, but also a link between the slope of the yield curve and the pricing of infrastructure assets: The steeper an yield curve, the lower the pricing. The argument behind such a relationship should be both a higher discount rate and a country effect, where long bonds from countries that are considered more risky to invest in, typically trade at a higher higher interest rate compared to short bonds from safer countries, where the risk is judged to be lower.
Overall, our analysis shows that infrastructure is very little sensitive to the fluctuations in the stock market and that the sensitivity is very dependent on the sub-asset class and business model. But with approx. 46% contracted and 28% regulated assets in the EDHEC index, a low sensitivity to economic developments was expected. The asset class’ bond-like cash flows give a natural sensitivity to interest rate developments and especially rising real interest rates must be expected to put pressure on the valuation of infrastructure.
Private Equity
Private Equity, which we in our analysis further subclassify into Buyout and Venture Capital, posted substantial losses during both the GFC and the dot-com crash. But there are some major differences to be seen. While Venture Capital, which invests in startup companies to help them grow, suffered the most during the dot-com crash, it kept better up during the GFC, but still posted losses of 30%. Buyouts, which are investments in mature companies, were only down by 18% during the dot-com crash.
There should not be much difference between how listed shares and unlisted shares, as within Private Equity, react to financial and economic crises. As shown in the scatter plots below, there is also a clear correlation between the returns on listed and unlisted companies. The correlation between S & P500 and Venture Capital is 0.77 and the same for Buyout. This is a bit unexpected, as start-ups should intuitively correlate less with the business cycle than more mature companies.
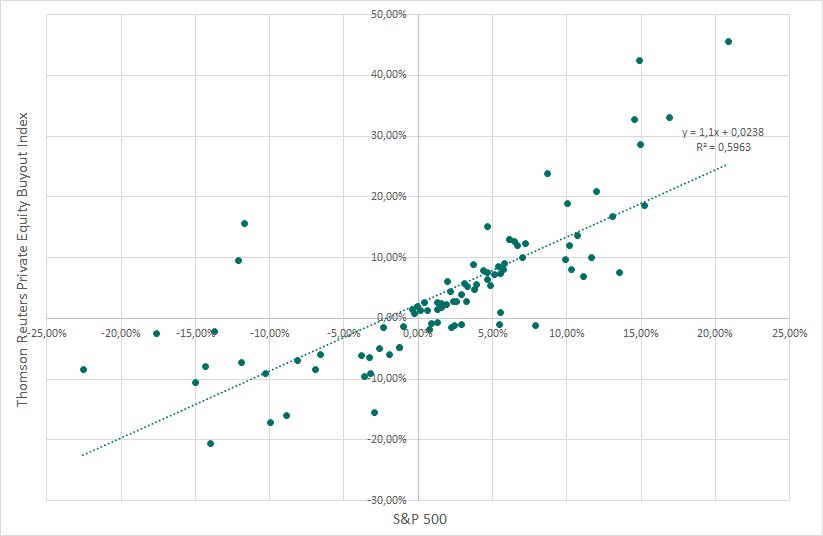
Source: Bloomberg & own calculations
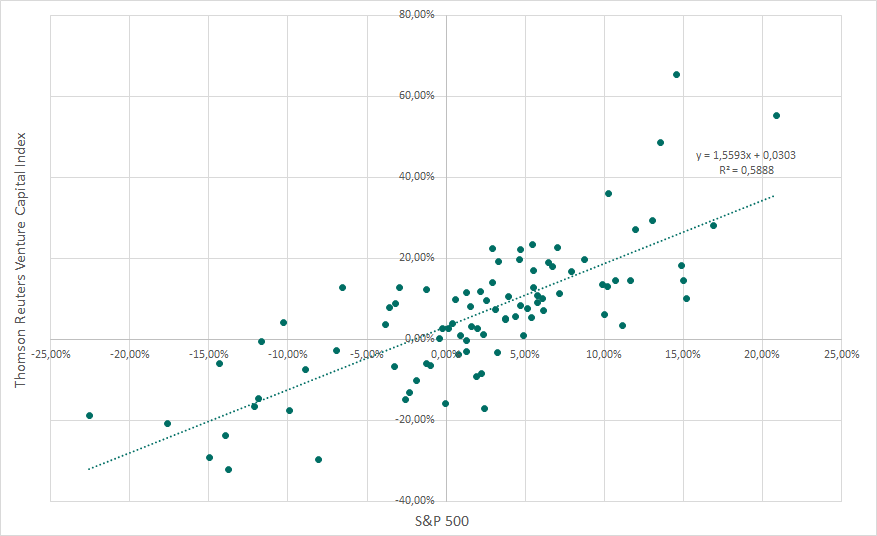
Source: Bloomberg & own calculations
As expected, there is a high correlation between the return on Private Equity and listed shares. Especially in an economic downturn, PE will experience negative returns just like stocks. Venture Capital can be expected to increase diversification slightly. The current high level of “dry powder”, i.e. commitments for money from investors to the PE funds but which has not yet been invested, should be a help for PE in the next crisis. Researchers from Harvard, Stanford and Kellogg have shown that private equity-owned companies with deep-pocket sponsors and record high dry powder going into the Great Financial Crisis actually fared way better than the control group, cf. Bernstein, Lerner and Mezzanotti (2017). Similar results were also published in Finans / Invest, cf. Poulsen and Lund-Nielsen (2010) and Brammer and Rants (2015).
Insurance-Linked Securities
Insurance-Linked Securities (ILS) were invented after hurricane Andrew in 1992 brought huge losses to the US insurance sector resulting in a shortage of reinsurance capacity. In 1997 the first CAT bond was issued to transfer (re-) insurance risks to the capital markets.
The market consists of listed “catastrophe bonds” (short: CAT bonds) and private, bilateral contracts (private ILS, PILS). CAT bonds typically cover natural catastrophes like hurricanes and earthquakes and have a term of three years while PILS are much more diverse in the perils covered and can include risks like lottery (lottery companies insure the risk the jackpot-risk on the ILS market) or terrorism or other man-made catastrophes but with a much shorter term, mostly 12 months.
Both CAT bonds and PILS have in common that they are fully collaterized and hence leave no counterparty risk to either party – which is a clear advantage compared to traditional reinsurance where the bankruptcy of a major reinsurer could have devastating consequences for insurance companies.
The return of ILS consists in a no-loss scenario of the collateral yield – which is typically floating rate – plus an insurance premium/spread. The size of the spread depends on the riskiness of the transaction and thus the probability of default and can be between low single digits to more than 20%. Due to the floating rate nature of the instruments there is no duration risk embedded. The payoff is solely depended on the non-occurrence of the insured event.
As can be seen from the chart below, ILS were more or less unaffected from the GFC. The small blip was triggered by losses from Hurricane Ike and – in fact – by some losses due to the bankruptcy of Lehman Brothers as a couple of CAT bonds had total return swaps with Lehman as counterpart as collateral. Lessons learned from the GFC are, that only US T-Bills or notes from IBRD and the likes are used as collateral.
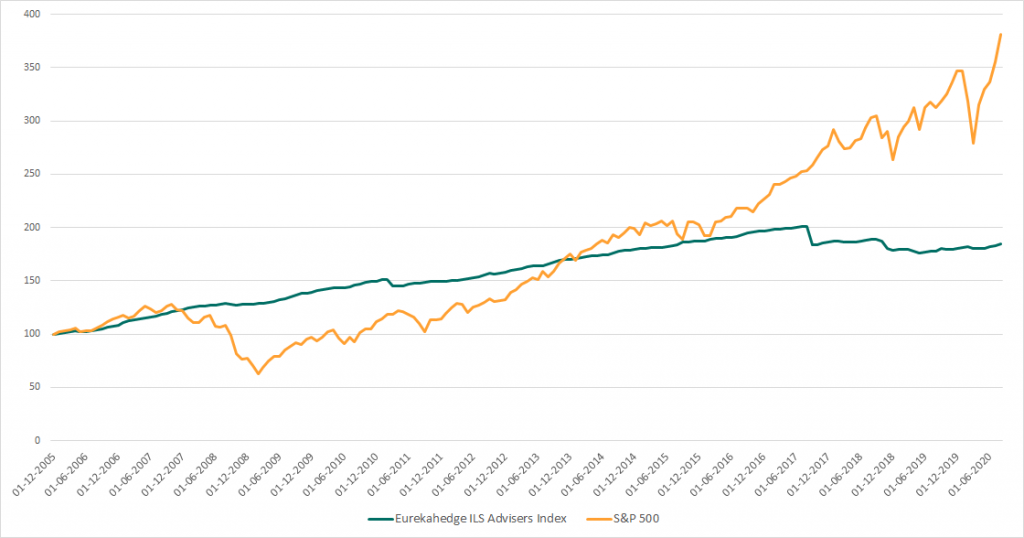
The larger losses in 2017 were caused by the landfall of three major hurricanes in the US (Harvey, Irma & Maria) as well as wildfires in California. Loss creep from these events still affected performance in both 2018 and 2019. In 2018, the Japanese typhoons Jebi and Trami and huge wildfires in California, in fact some of the most destructive and deadliest on record, led to losses of close to 4% for the year as a whole.
Historically, ILS have delivered returns in line with equities and high yield bonds but with substantially lower volatility. With that being said, volatility – or standard deviation – is certainly not the correct way to measure risk in this asset class with stable income during long periods of time and huge drawdowns every once in a while, when a major catastrophe hits.
A common reservation against this asset class, especially during the last few years, is the role of climate change. While there is no doubt about the existence of climate change, the influence on both the frequency and severity of hurricanes is not fully clear. And even if both should increase, the short-term nature of ILS instruments allows for a frequent repricing of the risk where an increase in risk should lead to an increase in premiums. And earthquakes, which is a major peril, are probably not significantly affected by climate change.
Due to the floating-rate nature of the ILS structures, there is no duration risk and hence no sensitivity to interest rate changes to be expected. As the payoff is contingent upon the non-occurrence of the insured event, there is no link to the business cycle either, as hurricanes and earthquakes do not happen more frequently during recessions than during upswings. However, one word of warning might be appropriate: a major catastrophe might send stock markets tumbling. Historically we have observed this after the earthquake and tsunami in Japan in 2011. The losses were limited to Japanese stocks, though, and did not affect a global equity portfolio in any major way. ILS might be the only truly uncorrelated alternative asset class.
COVID-19 update
The graph below shows the return development for alternative investments in the first half of 2020, i.e. in the middle of the corona crisis.
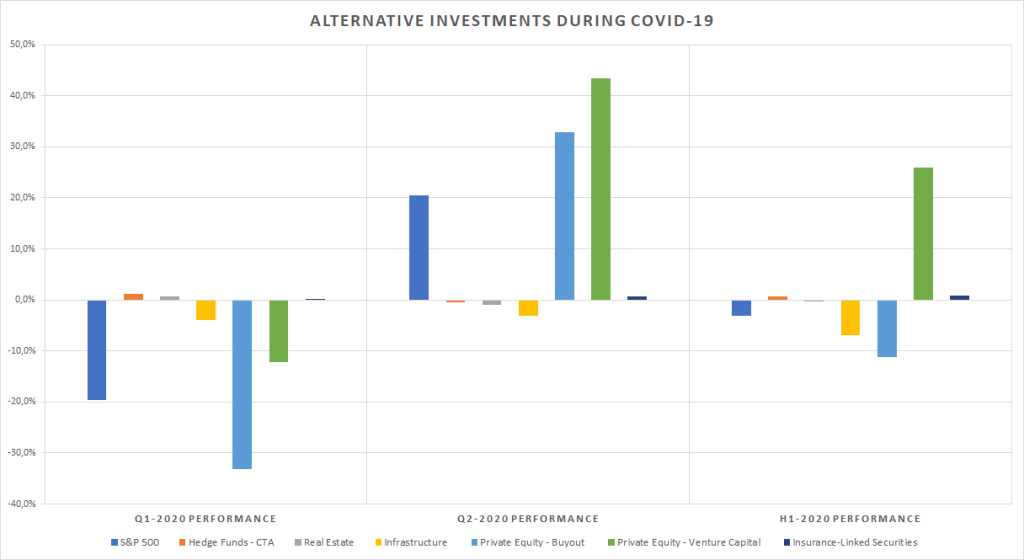
Some brief observations:
CTA are still the only asset class that has delivered consistently positive performance through all major crises during the last 40 years and the COVID-19 crisis has so far been no exception with a slightly positive return on index level but with huge dispersion on the underlying managers.
Real Estate has had a mixed performance through historical crises. Although the NCREIF index at the top level so far shows only modest losses, there is a very large difference at the sector level. Hotels and malls are hit very hard with losses of up to 20% at the index level, while grocery-anchored retail is not affected, and some parts of logistics may even profit as more retail has moved online in light of the pandemic. This is also reflected in the sector index for industrial, which is up 3.6% in the first half of 2020.
Infrastructure was hit harder than in an ordinary recession due to the lockdown of the economies, which hit the various transport sectors such as airports, public transport and toll roads unusually hard. Performance here also depends on the sector and business model where the “merchant” sector is more challenged. Lower interest rates support all other things being equal pricing of large parts of the “regulated” and “contracted” infrastructure, but the drop in interest rates was not enough to offset an increase in the equity risk premium which is also included in the discount rate which – according to EDHECinfra – has risen despite falling interest rates. Other market participants have experienced lower discount rates on assets with contractual cash flows with good counterparties in stable jurisdictions due to a “flight to quality” and increased demand for these assets.
Private Equity has – not surprisingly – not given any shelter in this crisis either but like real estate, it really depends on the business model how hard the crisis hit. While restaurant chains, event businesses, travel or oil related businesses have been severely hit, some tech driven businesses are profiting which is also reflected in the relative performance between Venture Capital (new economy) and Buyout (old economy). A word of caution is appropriate however, as the index used is a liquid replication benchmark that might overstate the impact over short time frames.
Insurance-Linked Securities posted positive returns during the GFC and kept also up quite well during the Corona crisis as it proved immune to the volatility created by the virus. CAT Bonds were slightly hit when investors pulled out of liquid investments that had not posted losses to cover margin calls but still positive performance. Even though there are some CAT Bonds covering pandemics, the largest part of the market is related to natural catastrophes like earthquakes and hurricanes and thus uncorrelated to the economy and equity markets. The asset class thereby reinforced its image of being uncorrelated.
Conclusions
Our analysis shows that alternative investments have performed very differently during historical downturns and that they are far from always providing the same portfolio protection as bonds.
Unfortunately, it is too early to conclude that the corona crisis is over. Therefore, in the coming quarters it will be interesting to follow how the various parts of alternative investments will perform and add new insights to our analysis.
Based on the historical experience, it is our recommendation that investors with significant shares of their portfolio invested in alternative investments, i.e. most institutional investors in Denmark and in the Nordic countries, take a thorough look at their portfolio to identify any unexpected risks which may give a negative surprise in the next economic downturn.
Investors must be very aware of the increased country risk on their alternative investments in the Eurozone in future economic downturns.
About the authors
Christoph Junge is Head of Alternative Investments at Velliv; a major Danish pension fund. He is a Chartered Alternative Investment Analyst and has more than 15 years of experience from the financial industry in both Denmark and Germany. He has worked with Asset Allocation, Manager Selection as well as investment advice in, among others, Nordea, Tryg and Jyske Bank. He was awarded Rising Star of the Year by Institutional Investor Institute in 2019.
Frank Hvid Petersen has a solid theoretical and practical experience with macroeconomics and financial markets after almost 25 years of working in the financial sector. He has been Head of Strategy and Portfolio Management at Carnegie Wealth Management and a portfolio manager of global equities and fixed income. Today he has his own advisory firm. Previous positions include joint Head of Strategic Investment Advise and Chief investment Strategist at Nordea including chairman of Nordea’s Global Investment Committee. Before that he was economist, chief economist and chief equity strategist at Alfred Berg. He has won several top rankings in the annual Prospera institutional investor rankings of best macroeconomic and equity strategy analysts. He holds a M.Sc. (Econ) and has extensive teaching and presentation experience.
Literature
Anson, Mark, 2012: Measuring Systematic Biases in Real Estate Returns: Alternative Investment Analyst Review, Q3 2012, Vol. 1, Issue 3, s. 44-61
https://www.caia.org/sites/default/files/4aiar-measure-2012-q3.pdf
Bernstein, Shai and Lerner, Josh and Mezzanotti, Filippo: Private Equity and Financial Fragility During the Crisis (July 2017). NBER Working Paper No. w23626,
Available at SSRN: https://ssrn.com/abstract=3011104
Brammer, Nikolaj Degn & Rants, Kim Olthaver Krogh, 2015: Kapitalfonde klarer sig relativt bedst under kriser. Finans/Invest, 04 / 2015, s. 19-28
Blanc-Brude, Frédéric & Tran, Christy, 2019: Which Factors Explain Unlisted Infrastructure Asset Prices?
https://edhec.infrastructure.institute/paper/which-factors-explain-unlisted-infrastructure-asset-prices/
Caplis, Jon, 2019: This Single Variable Explains What Drives Managed Futures Performance
https://www.institutionalinvestor.com/article/b1h140bdptcmhl/This-Single-Variable-Explains-What-Drives-Managed-Futures-Performance
Poulsen, Thomas & Lund-Nielsen, Bjørn, 2010: Kapitalfondsejede selskaber klarer tilsyneladende lavkonjunkturen bedre. Finans/Invest, 07 / 2010, s. 11-17
Wheaton, Bill, 2017: Has real estate been a good hedge against inflation? Will it be in the future?
https://www.cbre-ea.com/public-home/deconstructing-cre/2017/07/21/has-real-estate-been-a-good-hedge-against-inflation-will-it-be-in-the-future